Using game data between 2003 and 2014, we were able to generate a list of the dirtiest Premier League football teams in recent memory. We were also able to work out which clubs have carried out the least number of fouls over the past decade.
Dirtiest teams.
The following is a list of the dirtiest Premier League clubs in recent memory. It is ordered by their average fouls per game (2003–2014):
- Watford: 14.79 fouls per game.
- Leeds: 14.26 fouls per game.
- Leicester: 13.76 fouls per game.
- Blackburn: 13.55 fouls per game.
- Derby: 13.26 fouls per game.
The teams above have been heavily involved in relegation battles over the past ten years. At the time of publishing (November 2014), Leicester City were the only team still in the Premier League.
What if we were to only list the teams that have spent a considerable amount of time in the Premier League between 2003 and 2014?
- Blackburn: 13.55 fouls per game.
- Aston Villa: 12.704 fouls per game.
- West Ham: 12.31 fouls per game.
- Everton: 12.24 fouls per game.
- Wigan: 12.14 fouls per game
Note that we did not exclude Blackburn because they managed to avoid relegation until the end of the 2011–2012 season.
This is a little unfair, isn’t it? A lot can change in ten years. Players come and go, and the manager-merry-go-round has sped up.
Should the Aston Villa squad of 2012–2013 be blamed for the actions of the Aston Villa squad of 2004–2005? Of course not.
Dirtiest Premier League squads.
Let’s work out the dirtiest squads in recent memory.
- Newcastle committed 15.79 fouls per game in the 05-06 season.
- Blackburn committed 15.61 fouls per game in the 04-05 season.
- Aston Villa committed 15.26 fouls per game in the 04-05 season.
- Blackburn committed 14.95 fouls per game in the 05-06 season.
- Tottenham committed 14.84 fouls per game in the 03-04 season.
The first thing you’ll notice is that all of these squads existed between 2003 and 2006.
At first glance, it is easy to assume that more fouls were being committed back then. But is this actually true?
We decided to chart the data:
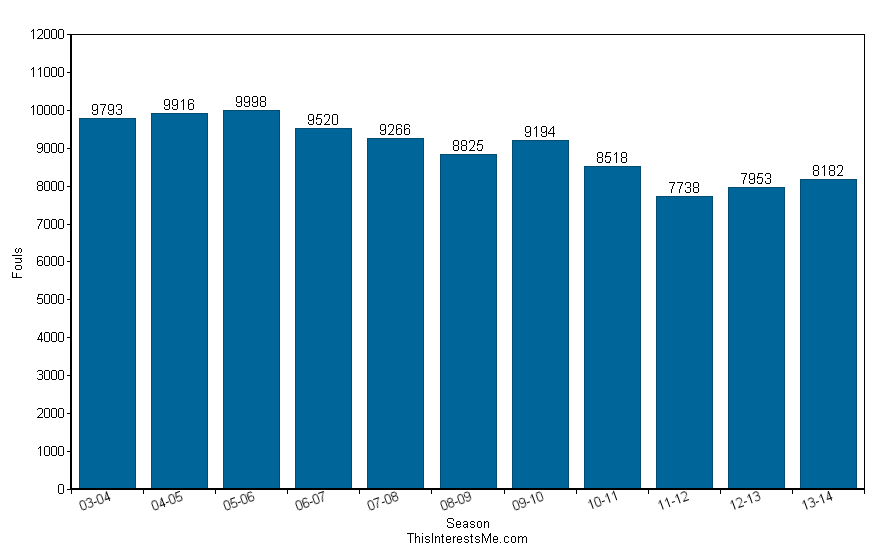
As you can see, this does seem to be the case, as there has been a noticeable decrease in the number of fouls committed per season. However, the reason for this decrease is up for debate.
We have identified the “dirtiest” squads in recent memory. However, what about the teams that have committed the least number of fouls?
- Swansea: 8.13 fouls per game in 2011-2012.
- Spurs: 8.95 fouls per game in 2011-2012.
- Cardiff: 9.00 fouls per game in 2013-2014.
- Spurs: 9.00 fouls per game in 2012-2013.
- Wolves: 9.08 fouls per game in 2011-2012.
Swansea’s 2011–2012 season is actually pretty remarkable, considering they committed 31 fewer fouls than the Spurs team of 2011–2012. Another interesting statistic is Everton’s fouls per game, which dropped from 10.87 in 2012–2013 to 9.61 in 2013–2014 (Moyes left).
Is this a case of better-performing teams committing fewer fouls? Or do managerial tactics have a bigger role to play?