In this guide, we are going to show you how to use the Finviz stock screener to find stocks that might be experiencing a breakout.
As you’re probably already aware, a breakout can occur when the price of a stock “breaks” through an area of resistance.
When a breakout happens, there is always a good chance that the price will continue to trend higher. This is because short sellers are covering, confidence in the stock is increasing and there are fewer sell orders to knock the price back down again.
PS: If you’re looking for a quick shortcut instead of a step-by-step guide, you can use the following Finviz link.
How to find breakouts with the free Finviz stock screener.
Firstly, you will need to go to the Finviz “Screener” section and click on the “All” tab.
In the first two columns, you will need to modify the following filters.
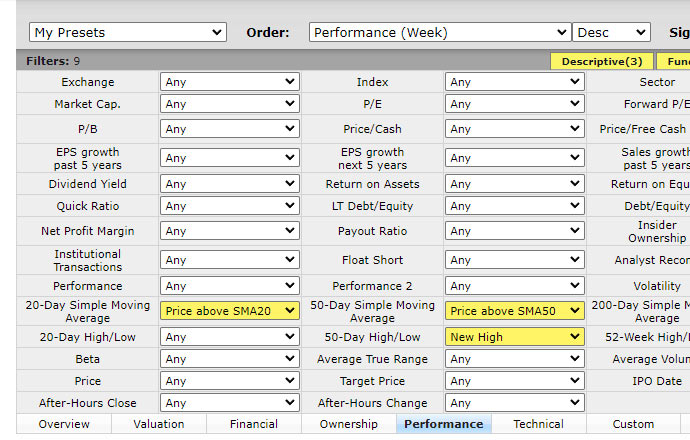
We set the 20-Day Simple Moving Average filter to Price above SMA20.
After that, we changed the 50-Day Simple Moving Average dropdown to Price above SMA50.
Finally, we set the 50-Day High/Low option to New High.
Now let’s move onto the other columns on the right.
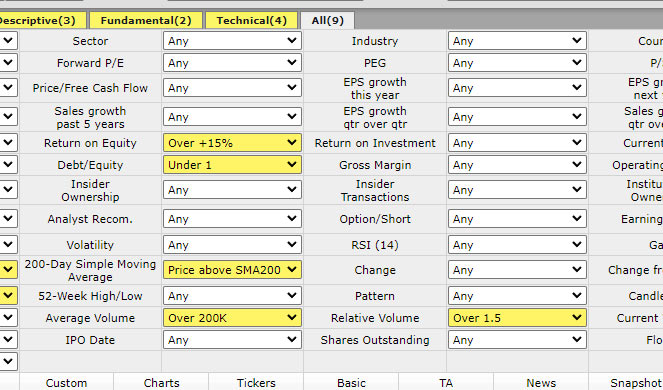
In the screenshot above, you can see that we have changed the following filters.
- Return on Equity: Over +15%.
- Debt/Equity: Under 1.
- 200-Day Simple Moving Average: Price above SMA200.
- Average Volume: Over 200K.
- Relative Volume: Over 1.5.
The two equity filters give us some semblance of quality control. They are there to try and screen out any companies that might be problematic. For example, if a company’s (D/E) Ratio is above 1, then it could be a sign that it has too much debt and is therefore riskier than its peers.
Breakouts require a high volume.
As you can see, we set the Average Volume option on our Finviz screener to Over 200K.
When it comes to detecting breakouts, uptrends and volatility, volume is our best friend. This is because a high volume confirms that something is happening and that a small number of trades aren’t causing swings in the stock price.
A low volume suggests that there is little interest in the ticker and that we might have problems exiting it at the right time.
For a breakout to happen, there usually needs to be a sign that others are willing to participate in it. In other words, there should be some sort of conviction among traders that a breakout is going to occur.
This basically means that the volume should be higher than it usually is. Hence the reason we set the Relative Volume filter to Over 1.5. This tells us that other traders are starting to see the same thing that we are.
Note that these filters do not guarantee that a stock will break above its resistance level and trend upward. For example, multiple breakout attempts can fail before one finally succeeds. There is also a chance that traders will lose patience and exit the stock, causing volume to fall.
The best way to protect yourself against a failed breakout is to set a stop loss at the line of resistance, or just below it. That way, you can at least minimize your losses if things start to go south.
Check out our other guides.